We will use them to see Javascript source code or run a command. These tools are available on all modern browsers.
Instructions are for chrome & firefox.
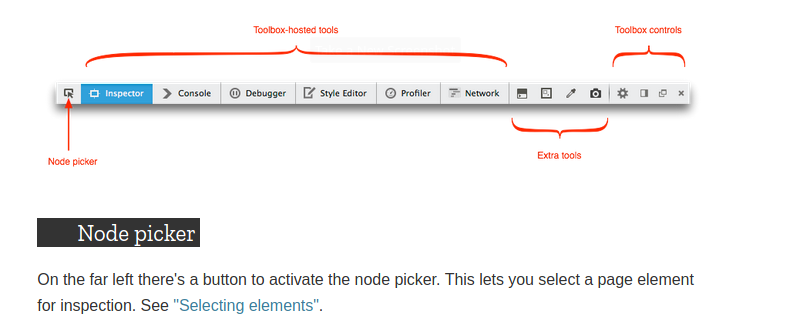
Open Dev tools:
- Press Ctrl + Shift + I
or - Right click > Inspect
Elements or Inspector Tab
The elements or Inspector tab allows you to look at the HTML and CSS code, that are used to define and style the website.
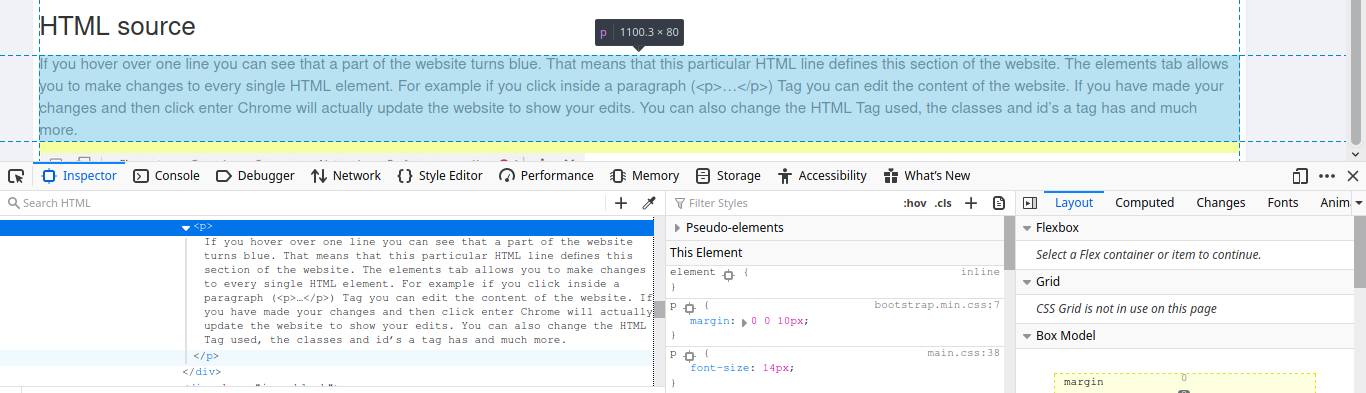
HTML source
Open inspect or developer tools, hover mouse over HTML code,the part which turns blue defines a section of the website.
We can change all the HTML elements using elements tab.
Ex: Inside <p></p> we can edit content of the website and save it and our browser will update the website.
We can edit tags,classes,ids and much more.
Note: These edits are only client side.
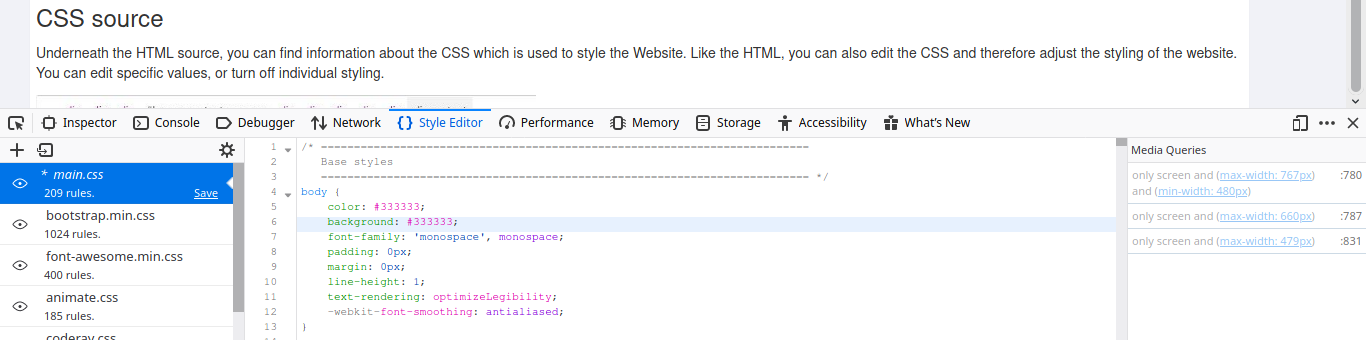
CSS source
Under style tab below HTML we can find and edit CSS to adjust the styling of the website.We can edit specific values, or turn off individual styling.
Console Tab
Show output of a a loaded JavaScript file.
Anything in red is an error but it has probably resolved itself.
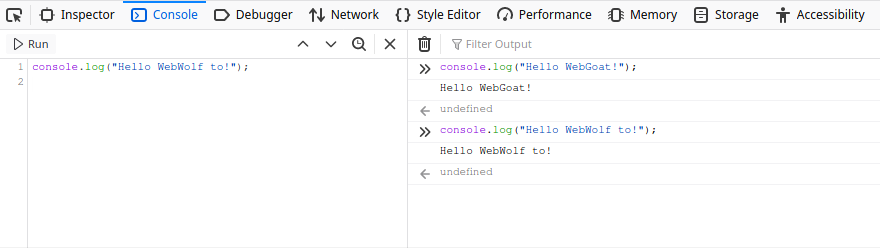
Through this tab we can run our own line of Javascript code.
To run your own code:
- Clear console - Ctrl +L or click on trash
- Click inside console and write something
console.log("Hello WebGoat!");
- Hit enter or press run and it wll print
Hello WebGoat!
- We can also perform basic arithmetic like
1+3
- It will print
4
undefined - means, that the JavaScript function you have called did not return anything.
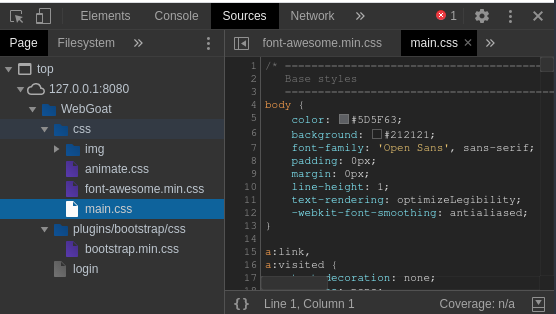
The Sources tab
In it we can check out the file system and view all the HTML, CSS and JavaScript files that are used, to create the website.
It is available on chrome only.
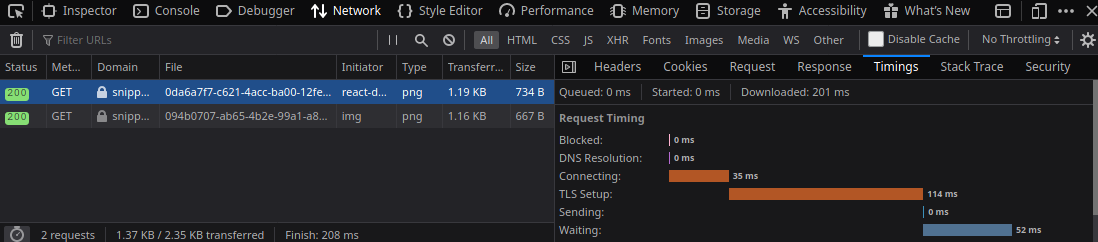
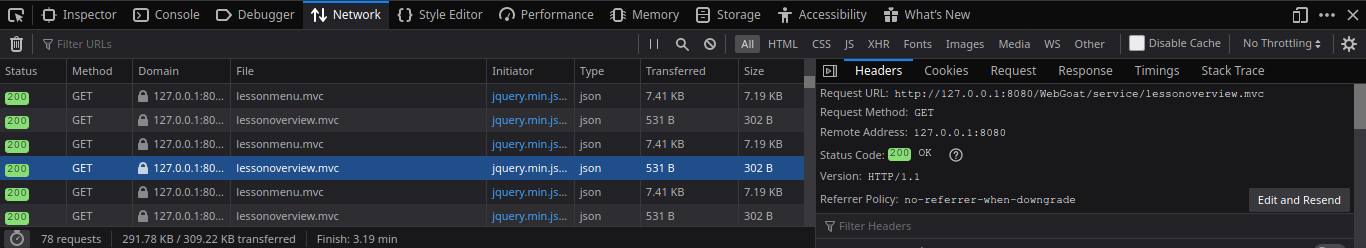
The Network tab
It shows HTTP requests and responses the website has performed.
Clicking on a request will provide more detailed information.
In chrome:
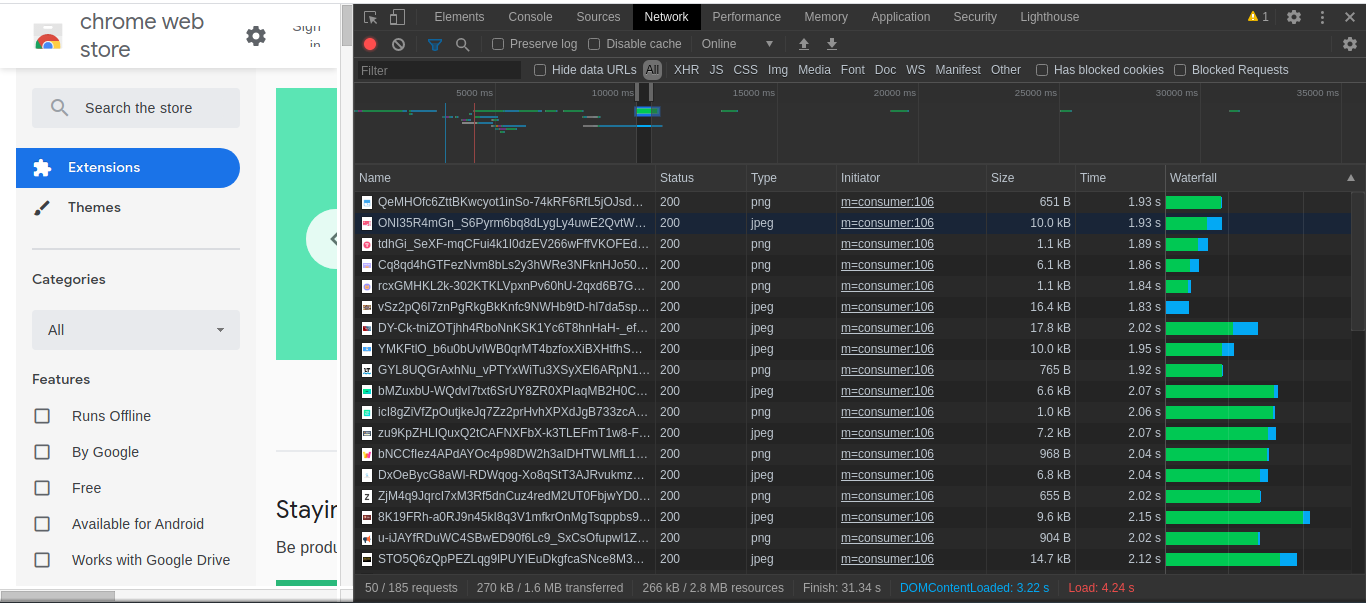
Timeline above the blue dots represent when these requests and responses have been performed.
To see request of a specific time frame click and drag on the timeline.
In firefox:
It also shows header,responses,cookies.